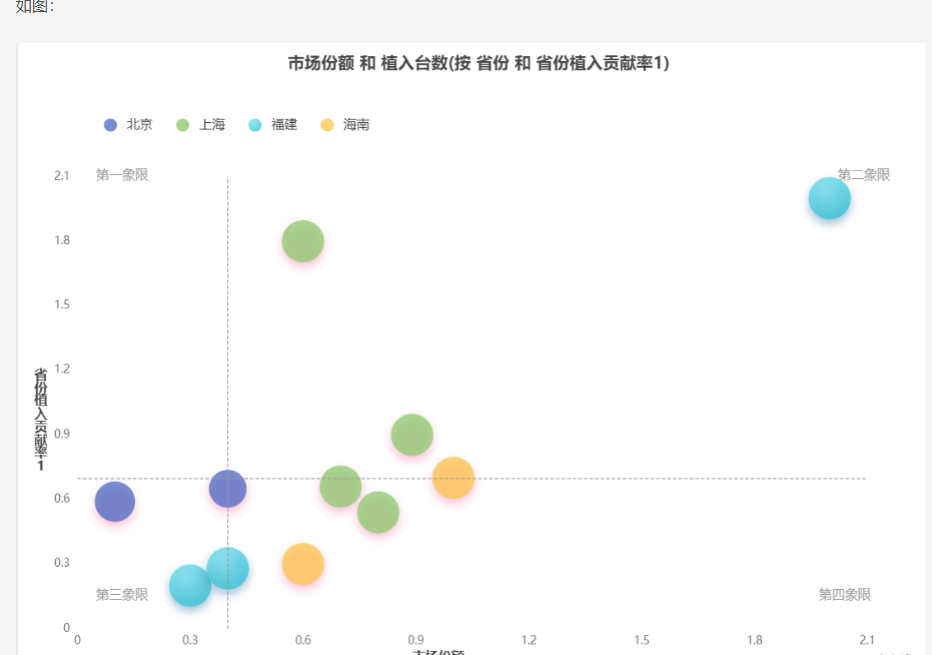
echarts 分象限实现气泡图
2023-03-24 13:25:24
538次阅读
0个评论
option = {
        title: [
          {
            text: '市场份额 和 植入台数(按 省份 和 省份植入贡献率1)',
            left: 'center',
            textStyle: {
              fontSize: 18,
            },
          },
          {
            text: '第一象限',
            z: 1,
            textAlign: 'center',
            left: '10%',
            top: '18%',
            textStyle: {
              fontSize: 14,
              fontWeight: 'normal',
              color: '#999',
            },
          },

          {
            text: '第二象限',
            z: 1,
            textAlign: 'right',
            left: '95%',
            top: '18%',
            textStyle: {
              fontSize: 14,
              fontWeight: 'normal',
              color: '#999',
            },
          },{
            text: '第三象限',
            z: 1,
            textAlign: 'center',
            left: '10%',
            top: '85%',
            textStyle: {
              fontSize: 14,
              fontWeight: 'normal',
              color: '#999',
            },
          },
           {
            text: '第四象限',
            z: 1,
            textAlign: 'center',
            left: '90%',
            top: '85%',
            textStyle: {
              fontSize: 14,
              fontWeight: 'normal',
              color: '#999',
            },
          },
            {
            text: '市场份额',
            z: 1,
            textAlign: 'center',
            left: '45%',
            top: '95%',
            textStyle: {
              fontSize: 14,
            },
          },
            {
            text: '省\n份\n植\n入\n贡\n献\n率\n1\n',
            z: 1,
            textAlign: 'center',
            left: '1%',
            top: '50%',
            textStyle: {
              fontSize: 14,
            },
          },
        ],
        grid: {
          top: '20%',
          left: '3%',
          right: '7%',
          bottom: '5%',
          containLabel: true,
        },
        tooltip: {
          formatter: (params) => {
            if (params.value.length > 1) {
              //${params.value[3]}%<br>
              return `${params.seriesName}:<br/>${params.value[0]}%<br>
              ${params.value[1]}%<br>`;
            }
            return false;
          },
          trigger: 'item',           // 触发类型,默认数据触发,见下图,可选为:'item' ¦ 'axis'
          showDelay: 20,             // 显示延迟,添加显示延迟可以避免频繁切换,单位ms
          hideDelay: 100,            // 隐藏延迟,单位ms
          transitionDuration : 0.4,         // 动画变换时间,单位s
          backgroundColor: 'rgba(0,0,0,0.7)',  // 提示背景颜色,默认为透明度为0.7的黑色
          borderColor: '#333',            // 提示边框颜色
          borderRadius: 4,                // 提示边框圆角,单位px,默认为4
          borderWidth: 0,                // 提示边框线宽,单位px,默认为0(无边框)
          padding: 5,                   // 提示内边距,单位px,默认各方向内边距为5,
                                // 接受数组分别设定上右下左边距,同css
            axisPointer : {                 // 坐标轴指示器,坐标轴触发有效
              type : 'line',         // 默认为直线,可选为:'line' | 'shadow'
            lineStyle : {          // 直线指示器样式设置
              color: '#48b',
              width: 2,
              type: 'solid'
            },
            shadowStyle : {              // 阴影指示器样式设置
              width: 'auto',         // 阴影大小
              color: 'rgba(150,150,150,0.3)'  // 阴影颜色
            }
            },
            textStyle: {
            color: '#fff'
            }

        },

        legend: [
          {
            orient: 'horizontal',
            x: '8%',
            y: '10%',
            align: 'left',
            data: ['北京'],
            textStyle: {
              fontSize: 14,
            },
          },
          {
            orient: 'horizontal',
            x: '16%',
            y: '10%',
            align: 'left',
            data: ['上海'],
            textStyle: {
              fontSize: 14,
            },
          },
          {
            orient: 'horizontal',
            x: '24%',
            y: '10%',
            align: 'left',
            data: ['福建'],
            textStyle: {
              fontSize: 14,
            },
          },
          {
            orient: 'horizontal',
            x: '32%',
            y: '10%',
            align: 'left',
            data: ['海南'],
            textStyle: {
              fontSize: 14,
            },
          },
        ],
        xAxis: [{
        axisLine:{
        symbolSize:[10,22],
          lineStyle:{
            width:0,
            type: [5, 10],
            dashOffset: 5
          }
        },
        axisTick:{
         show:false
        },
          onZero:true,
          type: 'value',
          scale: true,
          splitLine: {
            show: false,

          },
        },
        ],
        yAxis: [{
        axisLine:{
        symbolSize:[10,22],
          lineStyle:{
            width:0,
            type: [5, 10],
            dashOffset: 5
          }
        },
        axisTick:{
         show:false
        },
          onZero:true,
          type: 'value',
          scale: true,
          splitLine: {
            show: false,
          },
        }],
        series: [
          {
            name: '北京',
            z: 3,
            type: 'scatter',
            symbolSize: function (data) {
              return Math.sqrt(data[2]) / 5e2;
            },
            emphasis: {
              focus: 'series',
              label: {
              show: true,
              }
            },
            itemStyle: {
              shadowBlur: 10,
              shadowColor: 'rgba(255, 100, 150, 0.5)',
              shadowOffsetY: 5,
            },
            data: [
              [0.4, 0.65,412784114], [0.1, 0.59,472185121]
            ],
          },
          {
            name: '上海',
            z: 3,
            type: 'scatter',
            symbolSize: function (data) {
              return Math.sqrt(data[2]) / 5e2;
            },
            emphasis: {
              focus: 'series',
              label: {
              show: true,
              }
            },
            itemStyle: {
              shadowBlur: 10,
              shadowColor: 'rgba(255, 100, 150, 0.5)',
              shadowOffsetY: 5,
            },
            data: [[0.6, 1.8,517218965], [0.7, 0.66,517218965],
            [0.8, 0.54,517218965], [0.89, 0.9,517218965],
            ],
          },
          {
            name: '福建',
            type: 'scatter',
            symbolSize: function (data) {
              return Math.sqrt(data[2]) / 5e2;
            },
            data: [[0.3, 0.2,517218965], [0.4, 0.28,517218965],[2,2,517218965]],
            emphasis: {
              focus: 'series',
              label: {
              show: true,
              }
            },
            itemStyle: {
              shadowBlur: 10,
              shadowColor: 'rgba(25, 100, 150, 0.5)',
              shadowOffsetY: 5,
              color: new echarts.graphic.RadialGradient(0.4, 0.3, 1, [
              {
                offset: 0,
                color: 'rgb(129, 227, 238)'
              },
              {
                offset: 1,
                color: 'rgb(25, 183, 207)'
              }
              ])
            }
          },
          {
            name: '海南',
            type: 'scatter',
            symbolSize: function (data) {
              return Math.sqrt(data[2]) / 5e2;
            },
            data: [[0.6, 0.3,517218965],[1,0.7,517218965]],
            emphasis: {
              focus: 'series',
              label: {
              show: true,
              }
            },
            itemStyle: {
              shadowBlur: 10,
              shadowColor: 'rgba(255, 100, 150, 0.5)',
              shadowOffsetY: 5,
            },
          },
            {
            name:'',
            symbol: "none",
            type: 'scatter',
            label:{
              show:false,
            },
            labelLine:{
               show:false,
             },
            itemStyle:{
              normal: {
                color: '#999',
              },
             },
            data: [[0.4, 0.5]],
            markLine: {
              silent:true,
              symbol:'none',
              label:{
                show:false,
              },
              data: [
                {
                  type: 'average',
                  valueIndex: 0,
                },
              ],
            },
          },

                      {
            name:'',
            symbol: "none",
            type: 'scatter',
            label:{
              show:false,
            },
            labelLine:{
               show:false,
             },
            itemStyle:{
              normal: {
                color: '#999',
              },
             },
            data: [[0.5, 0.7]],
            markLine: {
              silent:true,
              symbol:'none',
              label:{
                show:false,
              },
              data: [
                {
                  type: 'average',
                },
              ],
            },
          },


        ],
      };
0
0